Aug 8, 2008 | 8:37 PM
Category:
Weather
From the VOA...
The World Meteorological Organization is
coordinating efforts by China and other countries to provide accurate
weather information for the upcoming Beijing Olympics. WMO says China
has installed a new geostationary satellite, at a cost of nearly $1
billion, which will enhance weather forecasting ability. Lisa Schlein
reports from WMO headquarters in Geneva.
An Olympic weather satellite launch at Taiyuan Satellite Launch Center in northern Shanxi Province, 27 May 2008The
success of the Beijing Olympics will largely be determined by athletic
prowess and record setting results. But, Director of Research at the
World Meteorological Organization, Leonard Barrie, tells VOA, the
weather can make or break a sporting event.
"Weather affects the
conditions in which the athletes have to perform," said Leonard Barrie.
"A thunderstorm in the middle of a 100 yard dash is not very desirable,
but inevitable in many cases."
As it turns out, thunderstorms
are hard to predict. But, Barrie says other weather phenomena can be
forecast with a great degree of accuracy several days in advance.
He
says many countries such as Australia, Canada, France, Japan and the
United States have expertise in weather forecasting and have brought
their most sophisticated systems to Beijing. He says they are doing
unique high resolution forecasting for the six to 36-hour period.
"They
attempt to tell the organizers and the athletes and their managers what
is expected as far as severe weather that would affect them-high winds
and precipitation, rain," he said. "And then, on time scales from six
to zero hours, we have something called the Now Casting project."

Beijing Olympic national stadium, known as Bird's Nest, covered by haze, 28 Jul 2008In
Now Casting, Barrie explains meteorologists use weather radar to locate
where rain or thunderstorms may be occurring. With this information, he
says it is possible to know when the bad weather can be expected to
arrive in Beijing.
The Olympic organizers have said they would
try certain measures to stop the rain from falling and spoiling
championship events. Barrie pours cold water on this plan.
"Weather modification has very limited number of true successes on record," said Barrie.
So
as not to throw a damper on the event, Barrie notes the weather
forecast indicates that the opening day of the summer games will have
very reasonable weather. But, he adds, he does not know whether there
will be a thunderstorm. That, he say, is unpredictable.
Aug 8, 2008 | 9:16 AM
Category:
Weather
Strong Start Increases NOAA’s Confidence for Above-Normal Atlantic Hurricane Season
August 7, 2008
2008
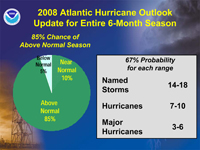
Atlantic Hurricane Outlook.
High resolution (Credit: NOAA)
In the August update to the Atlantic hurricane season outlook, NOAA’s Climate Prediction Center has increased the likelihood of an above-normal hurricane season and has raised the total number of named storms and hurricanes that may form. Forecasters attribute this adjustment to atmospheric and oceanic conditions across the Atlantic Basin that favor storm development - combined with the strong early season activity.
NOAA now projects an 85 percent probability of an above-normal season – up from 65 percent in May. The updated outlook includes a 67 percent chance of 14 to 18 named storms, of which seven to 10 are expected to become hurricanes, including three to six major hurricanes of Category 3 strength or higher on the Saffir-Simpson Scale. These ranges encompass the entire season, which ends November 30, and include the five storms that have formed thus far.
In May, the outlook called for 12 to 16 named storms, including six to nine hurricanes and two to five major hurricanes. An average Atlantic hurricane season has 11 named storms, including six hurricanes and two major hurricanes.
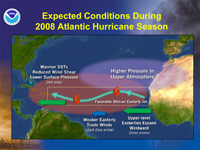
Expected Conditions During 2008 Atlantic Hurricane Season.
High resolution (Credit: NOAA)
“Leading indicators for an above-normal season during 2008 include the continuing multi-decadal signal – atmospheric and oceanic conditions that have spawned increased hurricane activity since 1995 – and the lingering effects of La Niña,” said Gerry Bell, Ph.D., lead seasonal hurricane forecaster at NOAA’s Climate Prediction Center. “Some of these conditions include reduced wind shear, weaker trade winds, an active West African monsoon system, the winds coming off of Africa and warmer-than-average water in the Atlantic Ocean.”
Another indicator favoring an above-normal hurricane season is a very active July, the third most active since 1886. Even so, there is still a 10 percent chance of a near normal season and a five percent chance of a below normal season.
Hurricane Dolly on July 23, 2008.
Hurricane Dolly on July 23, 2008.
High resolution (Credit: NOAA)
NOAA’s hurricane outlook is a general guide to the expected level of hurricane activity for the entire season. NOAA does not make seasonal landfall predictions since hurricane landfalls are largely determined by the weather patterns in place as a hurricane approaches.
Five named storms have formed already this season. Tropical Storm Arthur affected the Yucatan Peninsula in late May and early June. Bertha was a major hurricane and the longest-lived July storm (July 3-20) on record. Tropical Storm Cristobal skirted the North Carolina coastline. Dolly made landfall as a Category 2 hurricane at South Padre Island, Texas on July 25. And on August 5, Tropical Storm Edouard struck the upper Texas coast.
Water vapor animation.
Atlantic water vapor animation.
Download as Quicktime [MP4] (Credit: NOAA)
“It is critical that everyone know the risk for your area, and have a plan to protect yourself, your family and your property, or to evacuate if requested by local emergency managers. Be prepared throughout the remainder of the hurricane season,” Bell said. “Even people who live inland should be prepared for severe weather and flooding from a tropical storm or a hurricane.”
The Atlantic hurricane season includes activity over the Atlantic Ocean, Caribbean Sea and Gulf of Mexico. The peak months of the season are August through October.
NOAA understands and predicts changes in the Earth's environment, from the depths of the ocean to the surface of the sun, and conserves and manages our coastal and marine resources.
Here is the link
Jul 26, 2008 | 9:36 AM
Category:
Weather
Gloomy summer headed toward infamy
CHILLY: Anchorage could hit 65 degrees for fewest days on record.
By GEORGE BRYSON
[email protected]
Published: July 24th, 2008 12:10 AM
Last Modified: July 24th, 2008 04:56 PM
The coldest summer ever? You might be looking at it, weather folks say.
Click to enlarge
Story tools
Comments
E-mail a friend
Print
var tmpURL = window.location.href;
function im_story() {
var action;
msg = 'aim:goim?';
msg += 'message=';
msg += tmpURL;
document.Form.action = msg;
document.Form.submit();
}
function newsvine_story() {
window.open('http://www.newsvine.com/_wine/save?popoff=
1&u;="' + tmpURL + '"','newsvine','toolbar=no,width=590,height=600,resizab
le=yes,scrollbars=yes')
}
Digg this
Seed Newsvine
Send link via AIM

anchorage_dai626:http://www.adn.com/life/story/473786.h
tmlYahoo! Buzz
Font size :
A |
A |
A
Right now the so-called summer of '08 is on pace to produce the fewest
days ever recorded in which the temperature in Anchorage managed to
reach 65 degrees.
That
unhappy record was set in 1970, when we only made it to the 65-degree
mark, which many Alaskans consider a nice temperature, 16 days out of
365.
This year, however -- with the
summer more than half over -- there have been only seven 65-degree days
so far. And that's with just a month of potential "balmy" days
remaining and the forecast looking gloomy.
National
Weather Service meteorologist Sam Albanese, a storm warning coordinator
for Alaska, says the outlook is for Anchorage to remain cool and cloudy
through the rest of July.
"There's
no real warm feature moving in," Albanese said. "And that's just been
the pattern we've been stuck in for a couple weeks now."
In
the Matanuska Valley on Wednesday snow dusted the Chugach. On the Kenai
Peninsula, rain was raising Six-Mile River to flood levels and rafting
trips had to be canceled.
So if the
cold and drizzle are going to continue anyway, why not shoot for a
record? The mark is well within reach, Albanese said:
"It's probably going to go down as the summer with the least number of 65-degree days."
MEASURING THE MISERY
In terms of "coldest summer ever," however, a better measure might be the number of days Anchorage fails to even reach 60.
There too, 2008 is a contender, having so far notched only 35 such days -- far below the summer-long average of 88.
Unless
we get 10 more days of 60-degree or warmer temperatures, we're going to
break the dismal 1971 record of only 46 such days, a possibility too
awful to contemplate.
ADVERTISEMENT
');
//-->
<a
href="http://ad.doubleclick.net/jump/mi.adn00/Lifestyle
;dcove=d;pl=story;lvl6=Life;loc=ats;pos=MREC01;sz=300x2
50;tile=3;ord=123456789?"
target="_blank"><img
src="http://ad.doubleclick.net/ad/mi.adn00/Lifestyle;dc
ove=d;pl=story;lvl6=Life;loc=ats;pos=MREC01;sz=300x250;
tile=3;ord=123456789?"
border="0" alt="Advertisement"></a>
Still, according to a series of charts cobbled together Tuesday
evening by a night-shift meteorologist in the weather service's
Anchorage office, the current summer clearly has broken company with
the record-setting warmth of recent years. Consider:
• 70-degree days. So far this summer there have been two. Usually there are 15. Last year there were 21. In 2004 there were 49.
•
75-degree days. So far this summer there've been zero. Usually there
are four. It may be hard to remember, but last year there were 21. In
2004 there were 23.
So are all bets
off on global warming? Hardly, scientists say. Climate change is a
function of long-term trends, not single summers or individual
hurricanes.
Last year the
Intergovernmental Panel on Climate Change concluded that it's
"unequivocal" the world is warming, considering how 11 of the warmest
years on record have occurred in the past 13 years.
So what's going on in Alaska, which also posted a fairly frigid winter?
LA NINA
Federal meteorologists trace a lot of the cool weather to ocean temperatures in the South Pacific.
When
the seas off the coast of Peru are 2 to 4 degrees cooler than normal, a
La Nina weather pattern develops, which brings cooler-than- normal
weather to Alaska.
For most of the
past year, La Nina (the opposite of El Nino, in which
warmer-than-normal ocean temperatures occur off Peru) has prevailed.
But that's now beginning to change.
According
to the National Oceanic and Atmospheric Administration Web site, water
temperatures in the eastern South Pacific began to warm this summer --
and the weather should eventually follow.
The
current three-month outlook posted by the national Climate Prediction
Center in Camp Springs, Md., calls for below-normal temperatures for
the south coast of Alaska from August through October -- turning to
above-normal temperatures from October through December.
Jul 24, 2008 | 4:17 PM
Category:
Weather
Astronomical Note:
Scientists expose mystery behind northern lights
By MARCIA DUNN
AP Aerospace Writer
CAPE CANAVERAL, Fla. (AP) -- Scientists have exposed some of the
mystery behind the northern lights.
On Thursday, NASA released findings that indicate magnetic
explosions about one-third of the way to the moon cause the
northern lights, or aurora borealis, to burst in spectacular shapes
and colors, and dance across the sky.
The findings should help scientists better understand the more
powerful but less common geomagnetic storms that can knock out
satellites, harm astronauts in orbit and disrupt power and
communications on Earth, scientists said.
A fleet of five small satellites, called Themis, observed the
beginning of a geomagnetic storm in February, while ground
observatories in Canada and Alaska recorded the brightening of the
northern lights. The southern lights -- aurora australis -- also
brightened and darted across the sky at the same time.
These auroral flare-ups occur every two or three days, on
average.
A team led by University of California, Los Angeles, scientist
Vassilis Angelopoulos confirmed that the observed storm about
80,000 miles from Earth was triggered by a phenomenon known as
magnetic reconnection. Every so often, the Earth's magnetic field
lines are stretched like rubber bands by solar energy, snap, are
thrown back to Earth and reconnect, in effect creating a short
circuit.
It's this stored-up energy that powers the northern and southern
lights or, in other words, causes them to dance, according to
Angelopoulos.
An opposing theory has these geomagnetic events occurring much
closer to Earth, about one-sixth of the way to the moon. More
Themis observations are needed to resolve the debate, said David
Sibeck, NASA's project scientist.
"Finally, we have the right instruments in the right place at
the right time, and it's allowed scientists to be able to make the
necessary observations to settle this heated debate once and for
all," said Nicola Fox, a Johns Hopkins University scientist who
was not involved in the study.
At present, about 20 of these geomagnetic storms are being
analyzed. Scientists hope to eventually learn, via this project,
more about the bigger solar storms that occur about 10 times a year
and can lead to far more expansive and prolonged northern and
southern lights.
The five Themis spacecraft -- a NASA acronym standing for Time
History of Events and Macroscale Interations during Substorms --
were launched aboard a single rocket last year.
------
On the Net:
NASA: www.nasa.gov/themis
Jul 19, 2008 | 9:36 PM
Category:
Weather
NOAA: Warm June for U.S. with Wet and Dry Extremes,
Eighth Warmest June on Record for Globe
June 2008 was the 27th warmest June for the contiguous United
States, based on records dating back to 1895, according to an analysis
by NOAA's National Climatic Data Center in Asheville, N.C. The average
June temperature, 70.4°F, was 1.1 degrees above the 20th century mean,
based on preliminary data. The combined average global land and ocean
surface temperatures for June 2008 ranked eighth warmest for June since
worldwide records began in 1880, according to an analysis by NOAA's
National Climatic Data Center in Asheville, N.C. Also, globally it was
the ninth warmest January - June period on record.
U.S. Temperature Highlights
June temperatures were warmer than average across the southern and
eastern states, and cooler than average across the Northwest and
northern Plains.
New Jersey and Rhode Island ranked second warmest and Delaware
ranked third warmest, based on statewide data going back to 1895. Nine
states (Connecticut, Delaware, Maryland, New Jersey, Rhode Island,
Texas, Virginia, and North and South Carolina) were much warmer than
average, and 23 were warmer than average.
Seven states (Minnesota, Montana, Oregon, Washington, Wyoming, and North and South Dakota) were cooler than average.
Unusually warm June temperatures translated into a higher
temperature-related residential energy demand. Based on NOAA's
Residential Energy Demand Temperature Index, contiguous U.S.
temperature-related energy demand was approximately 7.5 percent above
average in June.
U.S. Precipitation Highlights
Rainfall patterns across the country in June consisted of both
extremely wet and extremely dry conditions. Heavy rain and flooding
occurred in the Midwest, while parts of the Southeast, southern Plains,
and West were dry.
Five states (Indiana, Iowa, Michigan, Ohio, and Vermont) were much
wetter than average for June, with Iowa ranking second wettest on
record.
Persistent heavy rain across the Midwest triggered flooding along
the Cedar River in Iowa, and many tributaries to the Mississippi River
in eastern Iowa and southern Wisconsin. Flooding also occurred along
the Mississippi River in parts of western Illinois and eastern
Missouri. By the end of June, 26 percent of the contiguous U.S. was
classified in moderate-to-extreme "wet spell" conditions, based on the
Palmer Index.
Over the past six months, Iowa, Ohio, and Missouri had the wettest
January-June on record. Iowa had its wettest April-June period on
record with an average of 20.4 inches of precipitation - 8.7 inches
above average.
Five states (California, Georgia, Tennessee, and the Carolinas) were
much drier than average, with California having the fourth driest June
on record and North Carolina ranking eighth driest.
Continued lack of rainfall across much of the Southeast and parts of
the southern Plains and West worsened drought conditions. Twenty-eight
percent of the contiguous U.S. was classified in
moderate-to-exceptional drought at the end of June compared to 22
percent a month ago, based on the U.S. Drought Monitor.
Western Wildfires
Dry conditions set the stage for increased fire potential across the
western U.S. By the end of June, many large wildfires were raging in
northern California and Arizona, largely due to lightning strikes. As
of June 30, more than 2.1 million acres have burned so far this year in
the United States, according to the National Interagency Fire Center.
Already, January - June 2008 ranks third behind the same periods for
2006 and 2002 in the amount of burnt acreage.
Global Highlights
The combined global land and ocean surface temperature for June 2008
was 60.8°F (16.0°C), which is 0.9°F (0.5°C) above the 20th century mean
of 59.9°F (15.5°C).
Separately, the global land surface temperature was 57.2°F (14.0°C),
which is 1.3°F (0.7°C) above the 20th century mean of 55.9°F (13.3°C).
The global ocean surface temperature was 62.2°F (16.8°C), which is 0.7°F (0.4°C) above the 20th century mean of 61.5°F (16.4°C).
For the January - June period, the combined global land and ocean
surface temperature was 57.1°F (13.9°C), which is 0.8°F (0.4°C) about
the 20th century mean of 56.3°F (13.5°C).
Other Highlights
Northern Hemisphere Arctic sea ice extent for June 2008 ranked third
lowest for June since records began in 1979. Southern Hemisphere
Antarctic sea ice extent for June 2008 was above the 1979-2000 mean,
ranking as the second largest June extent.
El Niño-Southern Oscillation conditions transitioned to a neutral phase during June.
Torrential rains lashed southern China from June 7-18. These were
followed by more heavy rain from typhoon Fengshen late in the month.
The downpours caused widespread floods and affected more than five
million people. June 2008 was the wettest month ever for Hong Kong,
Guangzhou, and Macao based on records that began in 1884.
Jul 19, 2008 | 8:08 AM
Category:
Weather
Sometimes seconds count. If a furious,
tornado-spitting thunderstorm was bearing down on your home
town, a few moments might make all the difference in the world.
Will
McCarty, a graduate student at the National Space Science
and Technology Center, is working with data from NASA's Aqua
satellite to improve short-term weather predictions--the kind
that could help you dodge that thunderstorm.
Above:
Severe weather over DeWitt, Michigan, on June 14, 2008. Photo
credit and copyright: Daniel O'Malley.
Guided
by his NASA mentor, Gary Jedlovec, McCarty has already learned
how to improve 48-hour forecasts by 3 hours. "That may
not sound like a big deal, but tell that to someone who escaped
a weather disaster by the skin of their teeth," says
McCarty.
They
accomplished the improvement by entwining measurements from
Aqua's Atmospheric Infrared Sounder (AIRS), into weather models.
To
understand how AIRS works its magic, let's first take a look
at how forecasts are made:

Sign up for EXPRESS SCIENCE NEWS delivery
Twice
a day, all over the world, weather balloons measure temperature,
wind, air pressure and humidity. These balloons sample the lowest
7 to 10 miles of Earth's atmosphere, where weather happens.
More measurements are made by surface observing stations, aircraft,
and weather radars. All these data form a "snapshot"
of the weather over the land at one point in time, every 12
hours.
Next,
the measurements are plugged into forecast models--computer-coded
equations that describe the interactions among the weather-influencing
variables mentioned above, plus others. A forecaster interprets
the model output to make his local weather prediction.
Sometimes
lives ride on this mundane sounding process.
"The
better we make the model output, the more the forecaster can
trust it and use it as a tool for forecasting, and the more
accurate forecasts the public receives," says McCarty.
 AIRS
improves the model output by improving its input: Riding on
NASA's Aqua spacecraft and viewing the atmosphere through
nearly 2,400 different spectral channels, AIRS creates an
accurate global 3-D map of atmospheric temperature, water
vapor, clouds and greenhouse gases.
AIRS
improves the model output by improving its input: Riding on
NASA's Aqua spacecraft and viewing the atmosphere through
nearly 2,400 different spectral channels, AIRS creates an
accurate global 3-D map of atmospheric temperature, water
vapor, clouds and greenhouse gases.
Right:
Will McCarty of the National Space Science and Technology
Center in Huntsville, Alabama. [more]
"AIRS
has finer resolution than previous instruments, so it can
make more detailed measurements," says McCarty. "This
makes analyses sharper, which improves the forecasts based
on them."
McCarty
and Jedlovec are most interested in AIRS infra-red "radiances,"
i.e., measurements of thermal energy emitted by the Earth's
surface and atmosphere. The researchers look at radiances
because they provide large scale measurements of the temperature
and water vapor patterns in the atmosphere.
"Radiance
measurements, in general, allow the observation of many places,
particularly over the oceans, that are sparsely measured directly
by traditional means, if at all," explains McCarty. "AIRS
gives us the best picture of the vertical temperature and
moisture structures ever made from space."
AIRS'
claim to fame, then, is its capacity to increase both the
area of Earth's atmosphere measured and the detail of those
measurements.
Above:
A typical AIRS infra-red weather snapshot. This is typhoon
Nakri, which Aqua flew over on May 28, 2008. [more]
What's
the next step? "Dealing with clouds," says McCarty.
"Infrared energy doesn't penetrate clouds well. When
clouds are around, the instrument is really only seeing the
tops of clouds."
When
clouds are low, however, there's still some good data from
the air above them because most of the atmosphere is still
being measured. These data have been wasted up to now – thrown
out in the bathwater along with all the other cloud-contaminated
data.
McCarty
is now working on an algorithm to identify which channels
are truly useless and which are valid. His method will help
identify what is good, useful data and increase the amount
of data collected, making even better forecasts possible.
He will soon plug his data into a forecast model to find out
just how much better.
A
3-hour improvement may be just the beginning.
Jun 19, 2008 | 12:15 PM
Category:
Weather
From EAX
Large Hail in the Northland the Evening of June 15, 2008
While
much of the widespread thunderstorm activity took place during the
daytime hours of the 15th. One very powerful supercell thunderstorm
developed near Leavenworth, KS and tracked eastward near the Kansas
City International Airport, and further east towards Kearney, Liberty,
and Richmond.
Since the moment it developed, this storm exhibited some of the classic
signals of producing very large hail, including a very powerful updraft
of air, high reflectivity values, and modest rotation in the mid-level
of the storm. Some of the largest hail reported in this storm was
around 2.75 inches near Leavenworth, KS and 2.25" near Kearney, MO.
Due to the very strong upwards motion of the storm, large hail was
actually thrown out of the storms and landed in places where the skies
were still blue!
As you can see in the images below, the
signature of hail can also be seen in radar imagery. A typical large
hail indicator is called a "three body scatter spike" (TBSS) or the
appearance of a beam of reflectivity away from the storm. In brief, simple terms, this is caused by the radar beam hitting the wet hail,
scattering to the ground below, then
scattering back upward, and finally being
scattered once again by the hail aloft. The 3
scatterings
illustrate the triple reflection, thus the term "three-body scatter
spike". In cases of extremely large hail, this TBSS can be seen in
many layers of the atmosphere as evident in the pictures below which
show 4 different levels of the storm as sampled by radar. For more
information on a TBSS, please visit the following site: http://www.srh.noaa.gov/bmx/significant_events/researc
h/3body/index.php
For additional information on how large hail is produced, please visit the NWS Jetstream page on large hail, found here
Radar Imagery ~8:50 PM
Radar Imagery ~9:35 PM (top and bottom)
Several Multi-Level Radar Views of Northland Hail Producing Supercell and TBSS
Hail Pictures
Various Hail Pictures From Leavenworth, KS and Kearney, MO
Jun 14, 2008 | 7:27 AM
Category:
Weather
In case you missed it...
...DAMAGE SURVEY RESULTS FROM JUNE 11-12 TORNADOES IN NORTHEAST
KANSAS...
DAMAGE SURVEY TEAMS HAVE REPORTED BACK ON THEIR PRELIMINARY FINDINGS
FROM TORNADOES IN NORTHEAST KANSAS. PRELIMINARY DATA INDICATES
THAT FOUR TORNADOES TOUCHED DOWN FROM TWO DIFFERENT SUPERCELL
THUNDERSTORMS BETWEEN 1012 PM AND JUST AFTER MIDNIGHT.
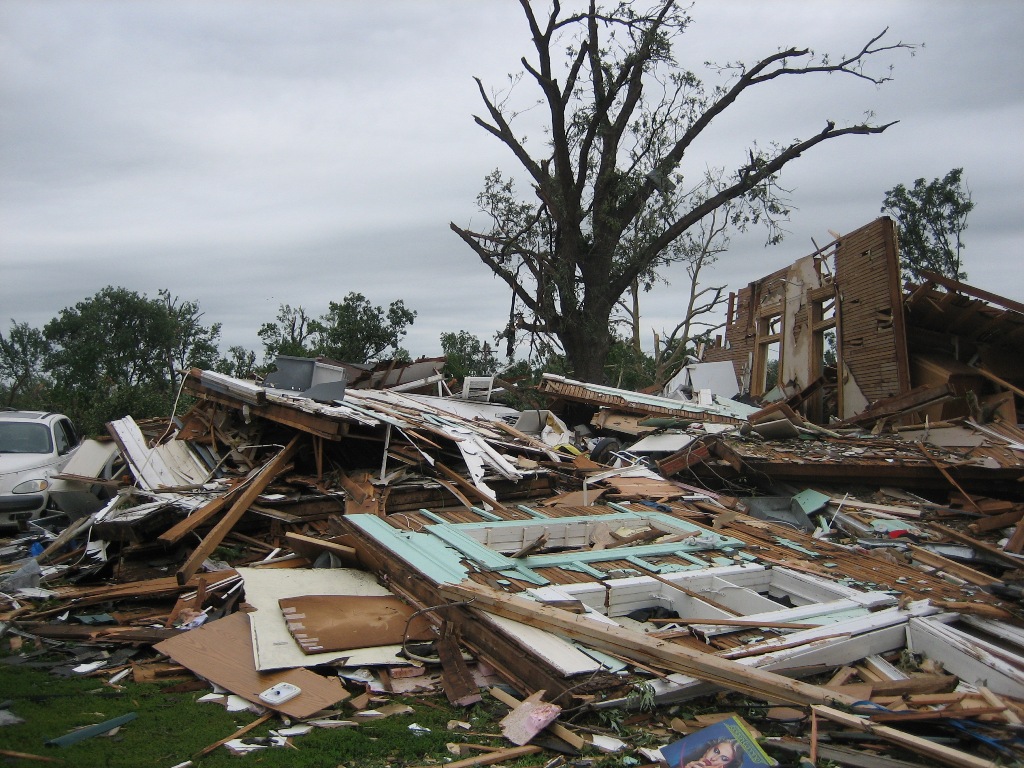
ONE TORNADO STRUCK THE CITY OF CHAPMAN...WHERE EF3 DAMAGE WAS NOTED.
ONE FATALITY OCCURRED IN THE CITY OF CHAPMAN. THE SECOND TORNADO
FROM THIS STORM STRUCK MANHATTAN AND INCLUDED THE K-STATE CAMPUS.
EF4 DAMAGE WAS NOTED IN SOUTHWEST MANHATTAN. THE THIRD TORNADO
BEGAN SOUTHWEST OF HAVENSVILLE...TRACKED EAST OF SOLDER...AND
DISSIPATED SOUTHWEST OF WETMORE. THE FOURTH TORNADO STRUCK IN FAR
SOUTHERN DICKINSON COUNTY NEAR CARLTON.
...CHAPMAN TORNADO...
* EVENT TYPE - EF3 TORNADO
* EVENT LOCATION - THE TORNADO TRACKED FROM NORTHWEST OF
ENTERPRISE THROUGH SOUTHEAST CHAPMAN TO WEST OF JUNCTION CITY
BEFORE DISSIPATING.
* PEAK WIND - 150 MPH ESTIMATED
* MAXIMUM PATH WIDTH - ESTIMATED 1/2 MILE
* PATH LENGTH - 11 MILES
* INJURIES - 4
* FATALITIES - 1
* DISCUSSION/DAMAGE - THE TORNADO TOUCHED DOWN APPROXIMATELY 1.5
MILES NORTH NORTHWEST OF ENTERPRISE KANSAS AT APPROXIMATELY 1012
PM. A GRAIN BIN WAS DESTROYED AT A FARMSTEAD AND TREE DAMAGE WAS
NOTED...BOTH CONSISTENT WITH EF0 WINDSPEEDS. AS THE TORNADO
MOVED NORTHEAST...DAMAGE TO TREES...ANOTHER GRAIN BIN...A CENTER
PIVOT AND POWERLINES OCCURRED AT QUAIL ROAD AND OLD HIGHWAY 40.
THE TORNADO THEN MOVED THROUGH THE SOUTHEASTERN HALF OF THE CITY
OF CHAPMAN CAUSING CONSIDERABLE DAMAGE TO NUMEROUS HOMES...CHURCHES
AND SCHOOLS IN THE CITY. THE ELEMENTARY/JUNIOR HIGH ON MARSHALL
AVENUE WAS HEAVILY DAMAGED AS WELL AS THE HIGH SCHOOL. THE
HARDEST HIT AREAS WERE BORDERED BY OLD HIGHWAY 40 TO THE
SOUTH...MARSHALL AVENUE ON THE EAST...7TH STREET ON THE
NORTH...AND BROADWAY STREET TO THE WEST. DAMAGE IN THIS AREA WAS
CONSISTENT WITH EF3 WINDSPEEDS AND THE WIDTH OF THE TORNADO WAS
APPROXIMATELY 1/2 MILE WIDE. THE TORNADO CONTINUED EAST
NORTHEAST AND DAMAGED TREES AND OUTBUILDINGS AT A FARMSTEAD
SOUTH OF I-70. THE TORNADO CROSSED I-70 AT DIETRICH ROAD BRIDGE
AND WAS APPROXIMATELY 1/4 MILE WIDE. THE TORNADO CONTINUED ABOUT
1 MILE EAST NORTHEAST UNTIL IT LIFTED NEAR THE INTERSECTION OF
MILFORD LAKE AND EASY JACKS ROAD AT APPROXIMATELY 1026 PM.
...MANHATTAN TORNADO...
* EVENT TYPE - EF4 TORNADO
* EVENT LOCATION - TORNADO TRACKED FROM AROUND 1 MILE NORTH OF
OGDEN AROUND 1048 PM...THROUGH THE CITY OF MANHATTAN WHERE THE
TORNADO THEN DISSIPATED JUST EAST OF THE K-STATE CAMPUS AROUND
1103 PM.
* PEAK WIND - 170 MPH ESTIMATED
* MAXIMUM PATH WIDTH - 1/4 MILE
* PATH LENGTH - 8.64 MILES
* INJURIES - NONE
* FATALITIES - NONE
* DISCUSSION/DAMAGE - THE TORNADO TRACKED FROM JUST NORTH OF OGDEN
TO NORTHEAST OF THE MANHATTAN AIRPORT WHERE DAMAGE WAS NOTED TO
A FARMSTEAD. A LARGE MACHINE SHED WAS COMPLETELY
DESTROYED...WITH A LARGE GRAIN CART FOUND IN AN ADJACENT FIELD.
THE MANHATTAN AUTOMATED OBSERVING SYSTEM REPORTED A PEAK WIND
GUST OF 66 MPH AT 1053 PM. THE TORNADO CONTINUED NORTHEAST WHERE
IT BROUGHT DOWN FRAMES TO HOMES UNDER CONSTRUCTION ON SCENIC
DRIVE. THE STORM THEN MOVED INTO THE MILLER RANCH AREA IN
SOUTHWEST MANHATTAN. EF4 DAMAGE WAS NOTED HERE...NEAR AMHERST
AVENUE AND PEACHTREE CIRCLE...MOST NOTABLY ALONG APPLEWOOD
DRIVE WHERE NUMEROUS FRAME HOMES WERE COMPLETELY DESTROYED. THE
TORNADO CONTINUED NORTHEAST...DAMAGING HOMES AND TREES ALONG
DARTMOUTH DRIVE AS WELL AS COMPLETELY DESTROYING ANOTHER HOME ON
CHIC CIRCLE. THE TORNADO CROSSED HIGHWAY 113 AT LITTLE APPLE
HONDA TOYOTA...WHERE NUMEROUS CARS WERE TOSSED AND WINDOWS WERE
BLOWN OUT OF THE SHOWROOM. THE HARDWARE STORE TO THE NORTH WAS
COMPLETELY DESTROYED...ALONG WITH SEVERAL ROWS OF SELF STORAGE
UNITS TO THE EAST. DAMAGE WAS CONSISTENT WITH EF3 WINDSPEEDS.
FROM THIS LOCATION...THE TORNADO THEN MOVED NORTHEAST...CROSSING
ANDERSON AVENUE NEAR MIDLAND AVENUE...THEN DAMAGING WINDOWS AND
REMOVING FENCING AT LEE ELEMENTARY SCHOOL. CONSIDERABLE DEBRIS
FELL ACROSS THIS AREA IN A WIDE PATH AS IT CROSSED ANDERSON
AVENUE. EF1 DAMAGE WAS NOTED JUST WEST OF THE K-STATE CAMPUS
WHERE THE ROOF WAS BLOWN OFF A FRATERNITY HOUSE AT COLLEGE
HEIGHTS ROAD AND DENNISON AVENUE. APARTMENTS IN THIS LOCATION
ALSO HAD WINDOWS BLOWN OUT AND A ROOF PARTIALLY REMOVED. EF1
DAMAGE WAS ALSO NOTED ON CAMPUS ITSELF...WITH NUMEROUS WINDOWS
BLOWN OUT OF BUILDINGS. THE USDA WIND EROSION LABORATORY HAD
SOME ROOF DAMAGE...AS WELL AS A SHED THAT WAS LOFTED OVER THE
TREES INTO THE PARKING LOT TO THE NORTH. CONTENTS IN THE SHED
REMAINED UNDAMAGED. DEBRIS FROM OTHER LOCATIONS IN MANHATTAN WAS
ALSO NOTED ON THE CAMPUS. THE TORNADO DISSIPATED SHORTLY AFTER
11 PM JUST EAST OF THE CAMPUS NEAR NORTH MANHATTAN AVENUE AND
CENTENNIAL DRIVE.
...TORNADO IN POTTAWATOMIE...JACKSON AND NEMAHA COUNTIES...
* EVENT TYPE - EF2 TORNADO
* EVENT LOCATION - 4 MILES SOUTHWEST OF HAVENSVILLE...NORTHEAST TO JUST
SOUTH OF SOLDIER...NORTHEAST TO 3 MILES SOUTHWEST OF WETMORE.
* PEAK WIND - 130 MPH ESTIMATED
* MAXIMUM PATH WIDTH - 300 YARDS
* PATH LENGTH - 16 MILES
* INJURIES - NONE
* FATALITIES - 1
* DISCUSSION/DAMAGE -THE TORNADO BEGAN ABOUT 4 MILES SOUTH
SOUTHWEST OF HAVENSVILLE...WHERE EF2 DAMAGE WAS SEEN TO A FARM
HOUSE AND TREES ON A FARMSTEAD ON LINCOLN ROAD...ABOUT 1.5 MILES
SOUTH OF K16.
THE TORNADO CONTINUED NORTHEAST AND CROSSED K16 AND K63...ABOUT 2
MILES SOUTH OF HAVENSVILLE...DOING EF1 DAMAGE TO TREES AND POWER
POLES. THE TORNADO THEN BEGAN MOVING EAST NORTHEAST TOWARD THE
SOLDIER AREA. POWER POLES AND SOME DAMAGE TO FARMSTEADS OCCURRED
ALONG THIS PATH...WITH THE DAMAGE BEING MAINLY EF0 AND EF1. ABOUT
ONE HALF MILE SOUTH OF SOLDIER...THE WORST DAMAGE OCCURRED WITH
TWO FARMSTEADS BEING HIT HARD. EF2 DAMAGE WAS SEEN HERE ON BOTH
HOUSES...AND IN THE GROVE OF HARDWOOD TREES...ALONG WITH A LOT OF
OTHER DAMAGE. WINDS AT THIS POINT WERE ESTIMATED AROUND 130 MPH.
MOVING EAST NORTHEAST...THE TORNADO CAUSED EF1 DAMAGE ALONG ITS
PATH EAST OF SOLDIER...ALONG AND JUST NORTH OF 270 ROAD. IT THEN
PROCEEDED NORTHEAST AND CROSSED THE JACKSON/NEMAHA COUNTY BORDER
4 MILES EAST NORTHEAST OF SOLDIER. THIS IS WHERE THE FATALITY
OCCURRED AS A MOBILE HOME WAS DESTROYED. THE TORNADO THEN MOVED
NORTHEAST WITH EF0 TO EF1 DAMAGE OCCURRING IN EXTREME SOUTHEAST
NEMAHA COUNTY...DISSIPATING ABOUT 3 MILES SOUTHWEST OF WETMORE.
THE TORNADO PATH LENGTH WAS 16 MILES...AND THE WIDTH VARIED FROM50
TO ABOUT 300 YARDS...WITH THE WIDEST DAMAGE PATH OCCURRING ONE
HALF MILE SOUTH OF SOLDIER.
THE NATIONAL WEATHER SERVICE IN TOPEKA WOULD LIKE TO THANK COUNTY
EMERGENCY MANAGEMENT...LAW ENFORCEMENT AND THE CITIZENS IN THE
AFFECTED AREA FOR THEIR EXTENSIVE HELP IN TRACKING THE DAMAGE
FROM THIS TORNADO.
...CARLTON TORNADO...
A METAL BUILDING WAS FOUND BLOWN DOWN AND THE TOP OF A TREE BLOWN
OFF. THIS STORM HAS NOT YET BEEN RATED.
Jun 12, 2008 | 12:43 PM
Category:
Weather
Several Tornadoes Reported in Northeast Kansas (Updated 6/12 12:18pm)
Three
teams of NWS meteorologists remain in the field early this afternoon.
They continue to survey damage and send reports and pictures back.
Another team of meteorologists from WFO Goodland is also en route to
Chapman and Manhattan to assist in the survey. A determination of
track and strength is not expected until this evening at the earliest.
As you can see from the pictures below, damage is extensive in
both Chapman and Manhattan. Another team is on site in Soldier but
have been unable to send any photos back yet. Click here for a list of storm reports from yesterday.
The image below displays storm plots of funnel clouds and tornadoes
received the evening of June 11th. Click on the image for a larger
version.
Below are a few damage photos taken by the team in Chapman.
(Click images for a larger view)
Below are damage photos taken from the team in Manhattan.
(Click images for a larger view)
Jun 11, 2008 | 10:06 AM
Category:
Weather
From NWS-Dodge City
Major Severe Weather Events May 22-26 (updated)
Major Severe Weather Events May 22nd, 23rd, 25th, and 26th!
...Including the Significant Tornado Outbreak of Friday, May 23rd --
*** UPDATED June 10 ****
There were 50...THAT IS NOT A TYPO...confirmed tornadoes in the Dodge City forecast area on May 23rd alone! A map of those tornadoes will be compiled and posted by the end of the week. There were other tornadoes on the 22nd, 25th and 26th. There were four tornadoes that produced EF3 damage...some long tracked and extremely large (wide). Again, details will be available by the end of the week. Check back often.
Two of the more significant tornadoes unfortunately produced injuries and fatalities. One tornado that tracked across south central into northeast Pratt county took two lives just east of Cairo on US Highway 54. Two occupants of a car parked on the shoulder were killed as their vehicle was carried about 250 yards into a field. Two persons in another vehicle sustained only minor injuries as their pickup got caught in a ditch and did not go airborne.
The tornado also took down some mighty trees that had stood for centuries. An occupant of a nearby house survived by taking shelter in a bathtub. The wall of the east side of the house collapsed on the man but he was not seriously hurt as the bathtub protected him from the weight. The highest intensity of the tornado produced EF3 damage.
Another tornado that produced EF3 damaged moved north toward the town of Macksville. After striking several farms, trees and pivot irrigation sprinklers, it turned north and passed to the west of the town. Unfortunately it did strike a home and caused serious injury to the occupant.
The track of the Macksville and Cairo tornadoes can be viewed by clicking the thumbnail
Additional significant tornadoes occurred elsewhere in western Kansas. Detailed information and tracks will be available the first week of June. Keep checking back.
Map of preliminary severe weather reports issued through Local Storm Reports product (LSR):
May 22nd & 23rd
May 25 & 26th
NOTE: The above two maps should be considered very preliminary, especially for the tornado reports. A final, detailed map of all tornado tracks across Dodge City, KS forecast area will be available as time permits, including start/finish times and Enhanced Fujita rating.
"Super-Res" WSR-88D Dodge City imagery from the May 23rd, tornado outbreak showing incredible Tornado Vortex Signatures!
6:29pm -- North of Kalvesta
7:26pm -- Southwest of Ransom
7:53pm -- Southeast of Bucklin
8:03pm -- South of Ogallah very near Cedar Bluff Dam
9:26pm -- 2 miles northwest of Hopewell
9:32pm -- About 10 miles south-southeast of Dodge City
9:58pm -- North and northwest of Coldwater
All Images are Here
Jun 8, 2008 | 10:33 PM
Category:
Weather
From the NWS in Chicago...see the weather blog for video of one of these storms that hit the south side...jl
Results from Storm Surveys of June 7th Tornadoes
...TORNADO DAMAGE SURVEYS FOR JUNE 7 2008...
SIX TORNADOES OCCURRED SATURDAY AFTERNOON AND EVENING OVER NORTHEAST
ILLINOIS.
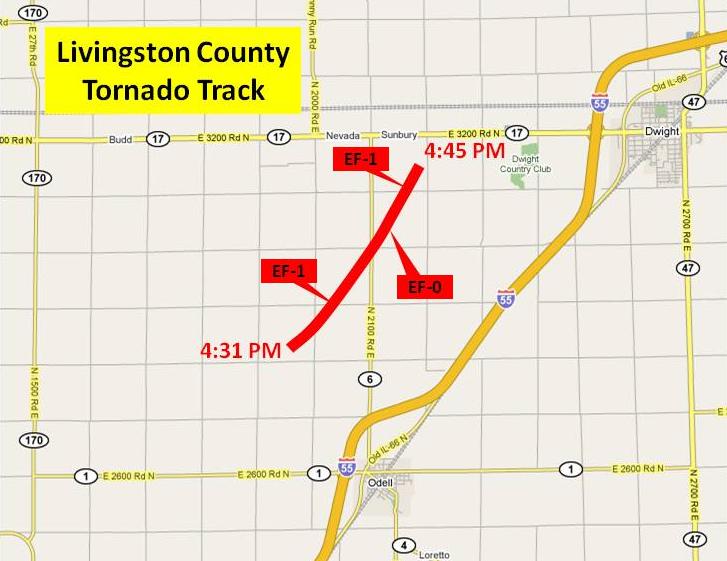
THE FIRST TORNADO OCCURRED IN LIVINGSTON COUNTY SOUTHWEST OF DWIGHT.
IT BEGAN NEAR 2000E AND 2900N ROADS. POWER POLES WERE SNAPPED ALONG
2900N. ON 2100E ROAD, NORTH OF 3000N ROAD A BARN LOST HALF OF ITS
ROOF. AT 3100N A HOUSE HAD ROOF DAMAGE AND TREE DAMAGE. THE TORNADO
ENDED NEAR 2200E AND JUST SOUTH OF 3200N.
THIS TORNADO HAD A PATH LENGTH OF 3.6 MILES AND MAXIMUM WIDTH OF 40
YARDS. IT BEGAN AT 431 PM AND ENDED AT 445 PM. IT WAS RATED EF1.
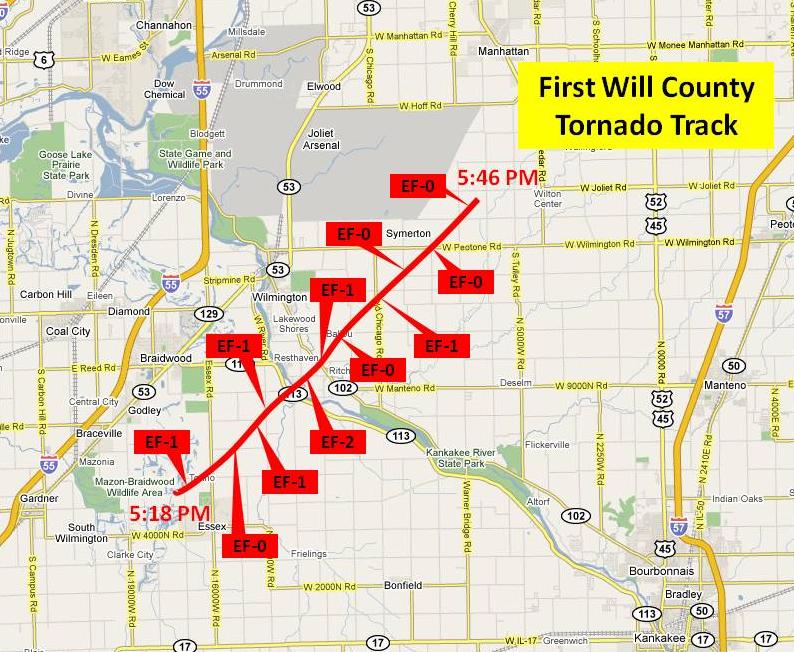
THE SECOND TORNADO OCCURRED NEAR THE SOUTHWEST WILL/NORTHWEST
KANKAKEE COUNTY BORDER, JUST NORTHWEST OF ESSEX. IT BEGAN JUST WEST
OF 17000W ROAD, JUST SOUTH OF COUNTY LINE ROAD. HERE IT UPROOTED
LARGE TREES AND SNAPPED A SMALL HARDWOOD TREE. IT BRIEFLY CROSSED
THE FAR NORTHWEST CORNER OF KANKAKEE COUNTY, THEN MOVED NORTH OF
COUNTY LINE ROAD BACK INTO WILL COUNTY. TREE TOPS WERE SHEARED AT
ESSEX ROAD AND COOPER ROAD. AT MCGUIRE ROAD A CLEAR PATH COULD BE
SEEN IN THE TREES. AT ROUTE 113 AND SMILEY ROAD, NEAR CUSTER PARK,
THE TORNADO SNAPPED AND UPROOTED TREES. ACROSS THE KANKAKEE RIVER A
2 STORY HOUSE HAD ITS ROOF COMPLETED REMOVED AND THERE WAS EXTENSIVE
TREE DAMAGE. THE TORNADO WAS RATED EF2 AT THIS POINT. THE TORNADO
CROSSED ROUTE 102 NEAR RITCHIE WHERE TREES WERE DAMAGED. THE TORNADO
CROSSED OLD CHICAGO ROAD NEAR KAHLER ROAD WHERE POWER LINES WERE
DOWN, A SHED AND BARN WERE DAMAGED, THERE WAS MINOR DAMAGE TO A
HOUSE. A SHED WAS DESTROYED. THE TORNADO WEAKENED AS IT MOVED FROM
SYMERTON AND KENNEDY ROADS TO WARNER BRIDGE AND ARSENAL ROADS. THERE
WAS NO DAMAGE EXCEPT TO ONE TREE. THERE WAS MINOR DAMAGE TO A BARN
AND TREE LIMBS NORTH OF ARSENAL ROAD BEFORE THE TORNADO DISSIPATED.
THIS TORNADO HAD A PATH LENGTH OF 13.6 MILES AND A MAXIMUM WIDTH OF
ABOUT 200 YARDS. IT BEGAN AT 518 PM AND ENDED AT 546 PM. IT WAS
RATED EF2.
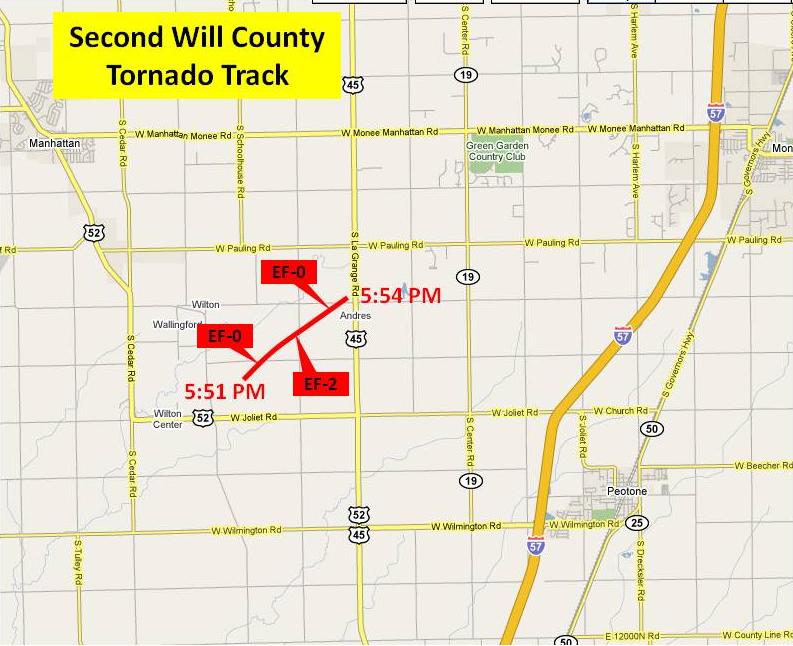
THE NEXT WILL COUNTY TORNADO BEGAN NORTHEAST OF WILTON CENTER, JUST
NORTH OF ROUTE 52 AND EAST OF ELEVATOR ROAD, WHERE THERE WAS MINOR
TREE DAMAGE. BASED ON PHOTOS AND EYEWITNESS REPORTS, THE TORNADO
GREW TO BE ABOUT 400 YARDS WIDE AT THIS POINT, BUT THIS WAS AN OPEN
AREA WITH FEW TREES OR STRUCTURES IN THE PATH. AT 120TH AVENUE A
GARAGE WAS DESTROYED AND ALL THAT REMAINED WAS A CINDER BLOCK BASE.
A METAL OUTBUILDING WAS SEVERELY DAMAGED. THIS TORNADO ENDED AT
MANHATTAN-WILTON ROAD JUST WEST OF ROUTE 45.
THIS TORNADO HAD A PATH LENGTH OF 1.8 MILES AND MAXIMUM WIDTH OF 400
YARDS. IT BEGAN AT 551 PM AND ENDED AT 554PM. IT WAS RATED EF2.
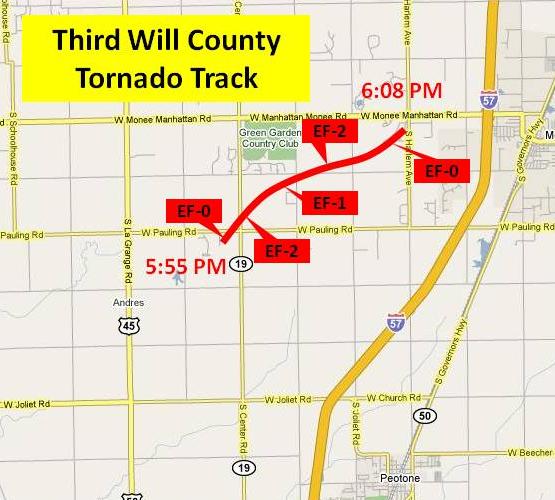
THE THIRD WILL COUNTY TORNADO BEGAN ALONG PAULING ROAD JUST WEST OF
CENTER ROAD, SOUTH OF THE GREEN GARDEN COUNTRY CLUB. A GARAGE WAS
LEVELED, AND A HOUSE HAD PART OF ITS ROOF TORN OFF AND DAMAGE TO
SECOND STORY EXTERIOR WALLS. AT THE SOUTHWEST CORNER OF BRUNS AND
88TH AVENUE, BARNS AND TREES WERE DAMAGED. THE TORNADO CONTINUED
ALONG BRUNS ROAD BETWEEN 80TH AND 88TH AVENUES. ON THE SOUTH SIDE
OF THE BRUNS ROAD A BARN AND AN OUTBUILDING WERE COMPLETELY
DESTROYED. THE HOUSE LOST A LARGE SECTION OF THE SOUTHEAST WALL ON
THE SECOND FLOOR. ANOTHER HOUSE WAS HEAVILY DAMAGED WITH SIDING AND
A WEST WALL BLOWN OFF. NORTH OF BRUNS ROAD, THERE WAS A BARN THAT
WAS PRACTICALLY DESTROYED WITH ONLY A PARTIAL WALL STANDING. A
HORSE BARN WAS DESTROYED WITH THE STABLES INTACT AND HORSES STILL
STANDING THERE. IN THE BACKYARD OF THE NEXT HOME, THERE WERE TREES
BLOWN DOWN AND DEBRIS, SUCH AS TRAILERS AND A SMALL ROW BOAT WERE
BLOWN INTO THE CREEK IMMEDIATELY NORTH OF BRUNS ROAD. A CHAIN LINK
FENCE WAS PULLED FROM THE GROUND. MANY TREES WERE UPROOTED AND /OR
BLOWN OVER AND POWER LINES WERE DOWN ON THE GROUND OR HANGING ON
TREES. THE NEXT HOUSE HAD DAMAGE TO TWO GARAGES. THE DOORS WERE
BLOWN OUT OF BOTH GARAGES AND THE ROOF OF ONE GARAGE WAS SEVERELY
DAMAGED. THE HOUSE HAD SIDING AND ROOF SHINGLES BLOWN OFF. A HOUSE
AT THE EAST END OF THIS SECTION OF BRUNS ROAD, CLOSEST TO 80TH
AVENUE HAD SIDING BLOWN OFF AND CHIMNEY DAMAGE. THE TORNADO WAS
RATED F2 BASED ON DAMAGE ALONG BRUNS ROAD. THE TORNADO APPARENTLY
ENDED SOUTHWEST OF THE INTERSECTION OF HARLEM AVENUE AND
MANHATTAN-MONEE ROAD, WHERE THERE WAS MINOR TREE DAMAGE.
THIS TORNADO HAD A PATH LENGTH OF 3.7 MILES AND A MAXIMUM PATH WIDTH
OF 150 YARDS. IT BEGAN AT 555 PM AND ENDED AT 608 PM. IT WAS RATED EF2.
THE TORNADO REDEVELOPED NEAR RIDGELAND AVENUE AND DRALLE ROAD, WHERE
A HIGH TENSION METAL TRUSS TOWER COLLAPSED AND FOUR OTHERS WERE
DAMAGED. POWER LINES BLOCKED I-57. THE TORNADO DESTROYED A MOBILE
HOME AND OUTBUILDINGS EAST OF RIDGELAND BETWEEN DRALLE AND STUENKEL
ROADS BEFORE CROSSING I-57. THE TORNADO WAS RATED EF2 IN THIS AREA.
SIX PEOPLE WERE INJURED IN VEHICLES ON I-57. EAST OF I-57 AT
STUENKEL ROAD A LARGE WAREHOUSE HAD BAY DOORS BLOWN IN, MUCH OF THE
ROOF COLLAPSED, AND THE WEST WALL BLOWN IN. POWER POLES WERE PUSHED
OVER ALONG SOUTH CENTRAL AVENUE. THE TORNADO CONTINUED NORTHEAST
THROUGH AN OPEN AREA BEFORE HITTING A SUBDIVISION ON THE NORTHWEST
CORNER OF STEGER ROAD AND CICERO AVENUE. LARGE TREE LIMBS WERE DOWN
AND A COUPLE TREES WERE UPROOTED. HOMES WERE SOMEWHAT SHELTERED BY
LARGE TREES AND ONLY SUSTAINED MINOR DAMAGE. ONE HOME NEAR CICERO
AVENUE HAD PART OF ITS ROOF TORN OFF. EAST OF CICERO AVENUE, THE
TORNADO WEAKENED SLIGHTLY AS IT MOVED THROUGH AN APARTMENT COMPLEX.
ONLY MINOR DAMAGE TO ROOFS, SOFFITS AND SIDING WAS NOTED. THE
TORNADO HIT ANOTHER SUBDIVISION ALONG IMPERIAL DRIVE. A FEW HOMES
HAD GARAGES PARTIALLY COLLAPSED OR DESTROYED. THE TORNADO THEN
PASSED THROUGH AN OPEN AREA BEFORE CROSSING GOVERNORS HIGHWAY AND
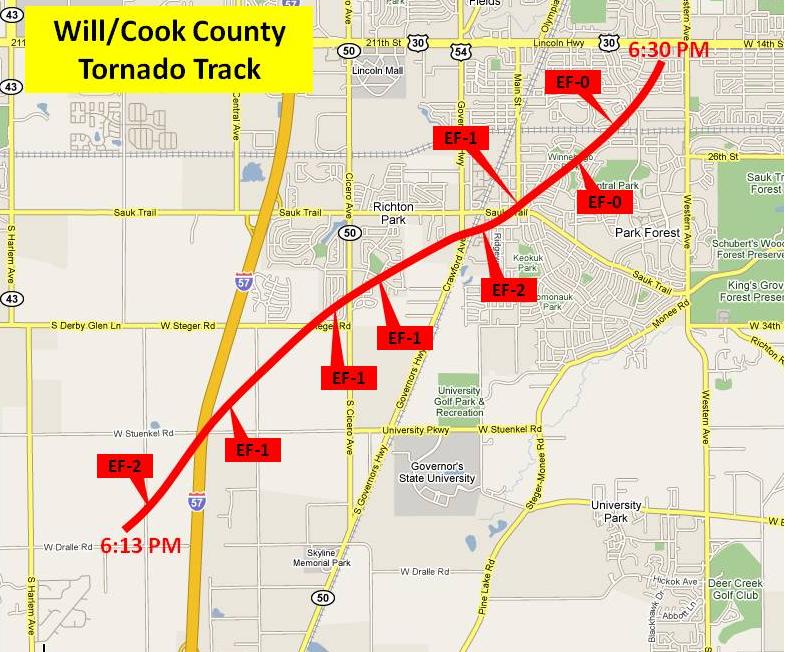
THE ILLINOIS CENTRAL TRACKS, JUST SOUTH OF SAUK TRAIL. THE TORNADO
HIT AN APARTMENT COMPLEX JUST EAST OF THE HIGHWAY AND RAILROAD
TRACKS. ONE THREE STORY BUILDING HAD MUCH OF THE ROOF RIPPED OFF AND
PART OF THE THIRD FLOOR EXTERIOR WALLS BLOWN DOWN. CARPORTS WERE
COLLAPSED AND OTHER BUILDINGS HAD MINOR DAMAGE. THE TORNADO WAS
RATED EF2 IN THIS AREA. THE TORNADO MOVED THROUGH THE INTERSECTION
OF SAUK TRAIL AND RICHTON SQUARE ROAD WHERE A GROCERY STORE AND CAR
WASH SUSTAINED DAMAGE. THE TORNADO THEN WEAKENED TO EF0 INTENSITY AS
IT CONTINUED NORTHEAST ACROSS CENTRAL PARK AVENUE AND THE NORTHWEST
PART OF CENTRAL PARK. ONLY MINOR DAMAGE TO TREES WAS OBSERVED IN A
SUBDIVISION IN THIS AREA. THE TORNADO CROSSED THE E J AND E TRACKS,
THEN IT DAMAGED A ROOF AT AN APARTMENT COMPLEX NEAR NORTH STREET AND
ORCHARD DRIVE. THE LAST SIGNS OF TREE DAMAGE WERE JUST SOUTHWEST OF
THE INTERSECTION OF LINCOLN HIGHWAY AND WESTERN AVENUE.
THIS TORNADO HAD A PATH LENGTH OF 5.8 MILES AND MAXIMUM WIDTH OF
ABOUT 150 YARDS. IT BEGAN AT 613 PM AND ENDED AT 630 PM. IT WAS
RATED EF2.
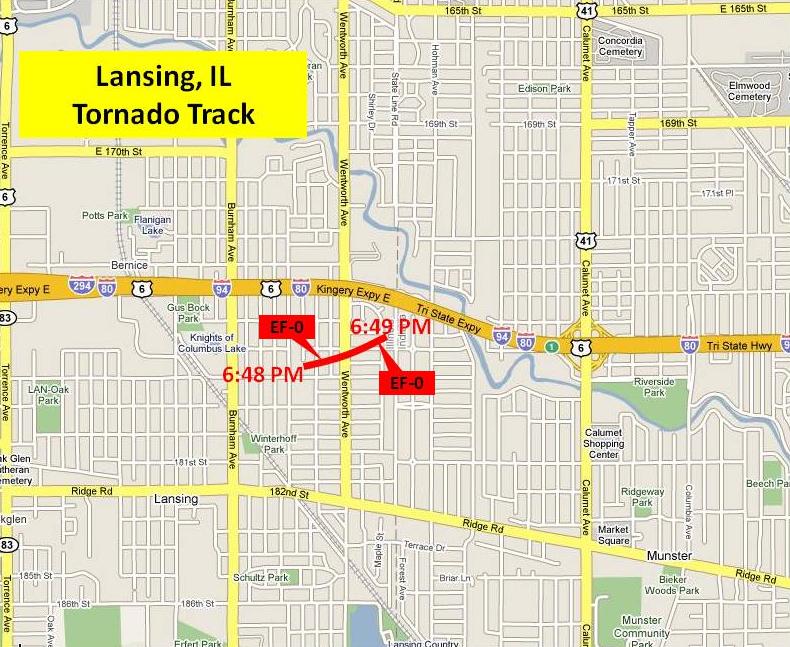
ANOTHER TORNADO BRIEFLY SWEPT THROUGH A SUBDIVISION IN LANSING. THIS
TORNADO BEGAN EAST OF BURNHAM ROAD NEAR 179TH STREET AND ENDED NEAR
THE INDIANA STATE LINE AND 177TH STREET. THIS TORNADO DAMAGED TREE
LIMBS. A FALLEN LIMB DAMAGED A CAR.
THIS TORNADO HAD A PATH LENGTH OF .7 MILES AND WIDTH OF ABOUT 50
YARDS. IT BEGAN AT 648 PM AND ENDED AT 649 PM. IT WAS RATED EF0.
Jun 7, 2008 | 8:53 AM
Category:
Weather
From Topeka NWS
Severe Thunderstorms Produce Tornadoes Across Portions of North Central Kansas June 5, 2008
Storm Damage Survey Completed for Ottawa and Clay Counties
The National Weather Service in Topeka, in cooperation
with Ottawa and Clay County Emergency Management surveyed storm damage
across portions of Ottawa and Clay County Friday, June 6th.
A write up of their survey is available at the bottom of the webpage. Information will be added to this webpage as it becomes available. Storm damage surveys are planned for portions of Marshall and Brown Counties by early next week.
Below is an image depicting sites where the Storm
Damage Survey Team concluded that tornado damage occurred in Clay
County. The red markers are labelled with the
preliminary ratings assigned to the tornado damage at each site. The
magenta
borders below indicate the tornado warning polygons that were in effect
at the time that the supercell moved through the area. The white lines
indicate county borders.
Click on the image below for a larger view.
The table of images below were taken by the Storm
Survey Team. The images are from the sites where tornado damage was
rated EF-1.
Click on any images below for a larger view.
Below is a write up of the Storm Damage Survey Results
from information collected through Friday, June 6th. Additional
information, including additional damage survey results will be
included in additional statements. Information will be added to this
website as it becomes available.
...PRELIMINARY RESULTS FOR TORNADO AND STRAIGHT LINE WIND DAMAGE
ACROSS NORTH CENTRAL AND NORTHEAST KANSAS...
OTTAWA COUNTY...
THE NWS SURVEYED LOCATIONS IN EASTERN OTTAWA COUNTY
WHERE SOME DAMAGE HAD BEEN REPORTED. AT 260TH AND MULBERRY ROADS,
THERE WAS MINOR DAMAGE AT A RESIDENCE. A GRAIN BIN HAD BEEN
KNOCKED OVER, A LIGHTED POLE IN THE YARD WAS KNOCKED DOWN. AT
270TH AND OXBOX ROADS, THERE WAS ROOF DAMAGE TO TWO OUTBUILDINGS,
THERE WAS ALSO DAMAGE TO A METAL OUTBUILDING. THE DAMAGE AT THESE
TWO LOCATIONS APPEARED TO BE STRAIGHT LINE WIND DAMAGE CONSISTENT
WITH THUNDERSTORM WINDS IN EXCESS OF 60 MPH.
CLAY COUNTY...
EF-0 DAMAGE LOCATIONS...THE FIRST LOCATION WHERE TORNADO DAMAGE
WAS NOTED WAS INSIDE THE CLAY COUNTY LINE APPROXIMATELY ONE HALF
MILE NORTHWEST OF OAK HILL. A HOME HAD SEVERAL WINDOWS BROKEN OUT,
DAMAGE TO A BACK PORCH AND ROOF. IN ADDITION, THERE WERE SEVERAL
TREES HEAVILY DAMAGED AND TWO OUTBUILDINGS DESTROYED. THE TORNADO
WAS 50 YARDS WIDE AT THIS LOCATION AND THE DAMAGE WAS CONSISTENT
WITH EF-0 WIND SPEEDS.
TORNADO DAMAGE WAS OBSERVED AT A FARM APPROXIMATELY ONE MILE
NORTHEAST OF IDANA. THE CATTLE FARM SUSTAINED DAMAGE TO A BARN,
FARM EQUIPMENT, AND A HEDGEROW OF TREES. TWO CAMPING TRAILERS WERE
DESTROYED. A NEIGHBOR TO THE EAST ALSO OBSERVED THE TORNADO. THE
TORNADO WAS 50 YARDS WIDE AND THE DAMAGE AT THIS LOCATION WOULD
BE CONSISTENT WITH EF-0 WIND SPEEDS.
EF-1 DAMAGE LOCATIONS...A WELL BUILT BRICK SINGLE STORY RESIDENCE
APPROXIMATELY 3.5 MILES WEST OF CLAY CENTER ON HIGHWAY 24
SUSTAINED DAMAGE TO THE ROOF, WINDOWS, TREES AND 3 OUTBUILDINGS
THAT WERE COMPLETELY DESTROYED. THE RESIDENTS AT THIS LOCATION
TOOK A PHOTOGRAPH OF THE TORNADO AS IT APPROACHED THEIR HOME. THE
TIME STAMP ON THE PHOTO WAS 4:32 PM. THE TORNADO AT THIS LOCATION
WAS 100 YARDS WIDE AND DAMAGE WAS CONSISTENT WITH EF-1 WIND SPEEDS.
ADDITIONAL TORNADO DAMAGE WAS OBSERVED NORTHWEST OF CLAY CENTER
AT A RESIDENCE LOCATED APPROXIMATELY 1.5 MILES NORTHWEST OF CLAY
CENTER. THIS RESIDENCE HAD 4 OUTBUILDINGS COMPLETELY DESTROYED
AND THE HOME LOST ROOF MATERIAL, A CONCRETE BLOCK GARAGE, AND AN
ATTACHED PORCH. MOST OF THE WINDOWS WERE BROKEN OUT OF THE HOME
AND A LARGE PIECE OF WOOD WAS EMBEDDED IN THE NORTH SIDE OF THE
HOME. THE TORNADO AT THIS LOCATION WAS 150 YARDS WIDE AND DAMAGE
WAS CONSISTENT WITH EF-1 WIND SPEEDS.
A RESIDENCE APPROXIMATELY 5 MILES NORTH OF CLAY CENTER SUSTAINED
DAMAGE TO THE ROOF, WINDOWS, AND TREES. A METAL CARPORT AND
OUTBUILDING WERE HEAVILY DAMAGED BY THE TORNADO. THE TORNADO AT THIS
LOCATION WAS 50 YARDS WIDE AND DAMAGE WAS CONSISTENT WITH EF-1
WIND SPEEDS.
STRAIGHT LINE WIND DAMAGE LOCATIONS...A METAL OUTBUILDING WAS
DESTROYED AND TREE DAMAGE WAS NOTED AT A RESIDENCE NEAR THE
INTERSECTION OF 14TH AND ELK ROADS OR ABOUT 2.5 MILES SOUTHWEST OF
IDANA. TWO OUTBUILDINGS THAT WERE WOOD FRAME AND TIN SHEETING WERE
DESTROYED AT A RESIDENCE LOCATED JUST EAST OF THE INTERSECTION OF
16TH AND HACKBERRY ROADS, OR ABOUT 1.5 MILES SOUTHEAST OF IDANA.
POWER LINES WERE ALSO DOWN NEAR THIS HOME AND ALONG HACKBERRY RD.
IN THIS AREA. THE DAMAGE AT THESE LOCATIONS WERE LIKELY DUE TO
STRAIGHT LINE WINDS ON THE BACK SIDE OF THE SUPERCELL THUNDERSTORM
THAT PRODUCED THE TORNADO.
MARSHALL AND BROWN COUNTIES...
DAMAGE SURVEYS HAVE NOT YET BEEN COMPLETED AT THIS TIME.
ADDITIONAL INFORMATION TO COME...
ADDITIONAL DAMAGE REPORTS WERE RECEIVED IN NORTHEAST CLAY COUNTY
AND INFORMATION WILL BE SURVEYED BY CLAY COUNTY EMERGENCY
MANAGEMENT. NONE OF THE DAMAGE OBSERVED WAS GREATER THAN EF-1.
ADDITIONAL REPORTS OF MINOR DAMAGE NEAR OKETO IN NORTH CENTRAL
MARSHALL COUNTY AND BETWEEN MORRILL AND RESERVE IN NORTH CENTRAL
BROWN COUNTY ARE CONSISTENT WITH WEAK TORNADIC CIRCULATIONS.
DAMAGE SURVEYS AT THESE LOCATIONS HAVE NOT YET BEEN
COMPLETED...BUT INFORMATION WILL BE RELEASED AS SOON AS THESE
SITES ARE SURVEYED BY THE NWS OR MARSHALL AND BROWN COUNTY
EMERGENCY MANAGEMENT TEAMS...THE INFORMATION WILL BE RELEASED TO
THE PUBLIC.
METEOROLOGICAL NOTE...
THE EXACT NUMBER OF TORNADOES AND THEIR PATHS HAVE NOT YET BEEN
DETERMINED. ON RADAR SEVERAL POTENTIAL TORNADIC CIRCULATIONS WERE
OBSERVED ROTATING AROUND THE BASE OF THE SUPERCELL
THUNDERSTORM...OCCULUDING...AND THEN REDEVELOPING TO THE EAST. ONCE
ALL DAMAGE SURVEYS ARE COMPLETED AND RADAR DATA CAN BE COMPARED TO
DAMAGE SURVEY RESULTS...THE NUMBER OF TORNADOES AND THEIR PATH
LENGTHS WILL BE DETERMINED. THE DAMAGE ASSOCIATED WITH THE
MARSHALL AND BROWN COUNTY TORNADOES ARE EXPECTED TO BE RATED EF-1
OR EF-0 DUE TO PRELIMINARY REPORTS OF MINOR DAMAGE.
Jun 6, 2008 | 11:14 AM
Category:
Weather
From EAX
A powerful storm system swept across the central
plains and midwest yesterday bringing a swath of severe weather to the
area. Tornadoes, damaging winds and hail were reported from West
Central Texas northward into the Great Lakes. The image below depicts
severe weather reports across the NWS Pleasant Hill county warning area
from 6am to 6am June 5/6. Meteorolgist from the National Weather
Service Forecast Office have been deployed to survey the possible
tornado damage and further information will be updated as it becomes
available.
5 tornado reports
2 hail reports
12 wind reports
Tornado Reports
Time (UTC)
Location
County
State
Lat
Lon
Comments
2355
WATSON
ATCHISON
MO
40.48
-95.62
911 REPORTING TORNADO ON GROUND NEAR WATSON. (EAX)
0023
6 E ROCKPORT
ATCHISON
MO
40.42
-95.4
MULTIPLE TORNADOES ON THE GROUND (EAX)
0053
CORNING
HOLT
MO
40.25
-95.45
LARGE TORNADO ON THE GROUND CROSSING MISSOURI RIVER NEAR HOLT AND ATCHISON COUNTY LINE MOVING NORTHEAST. (EAX)
0055
CRAIG
HOLT
MO
40.19
-95.37
TWO SEMI TRUCKS BLOWN OVER INJURIES UNKNOWN BUT ONE DRIVER REQUIRING EXTRICATION. MILE MARKER 92 ON INTERSTATE 29. (EAX)
0104
2 SE TARKIO
ATCHISON
MO
40.42
-95.36
TRAINED SPOTTER REPORTED TORNADO ON THE GROUND BECOMING RAIN-WRAPPED. (EAX)
Jun 2, 2008 | 10:58 PM
Category:
Weather
From EAX...
Morning and Early Afternoon Pack a Punch
HAIL...DAMAGING WINDS...FLASH FLOODING
A complex of
thunderstorms developed across south central Nebraska around sunrise on
Monday, strengthening as they moved southeast across north central
Kansas. The
storms increased to severe strength across northeast Kansas by the late
morning hours, as they continued to move southeast into west central
Missouri. Very large hail, damaging thunderstorm winds and flash
flooding accompanied the storms as they tracked southeast. A supercell
thunderstorm embedded in the complex of storms produced baseball to
grapefruit-size hail as it tracked along interstate 35 between Emporia
and Ottawa. As the storm moved into west central Missouri, hail sizes
in the half dollar to golfball size range were more common, though
baseball size hail was reported near Rich Hill. In addition to the
large hail, thunderstorm wind gusts estimated between 60 and 80 miles
an hour felled trees and even tore a roof off a home near Trading Post,
Kansas. Several snapshots of the radar as the storm moved from Paola,
Kansas to Butler, Missouri are shown below. In addition, a preliminary
map of storm reports is displayed below.
12:30 pm
12:44 pm
1:09 pm
1:34 pm
1:48 pm
Click here for a complete listing of storm reports
Jun 1, 2008 | 8:33 AM
Category:
Weather
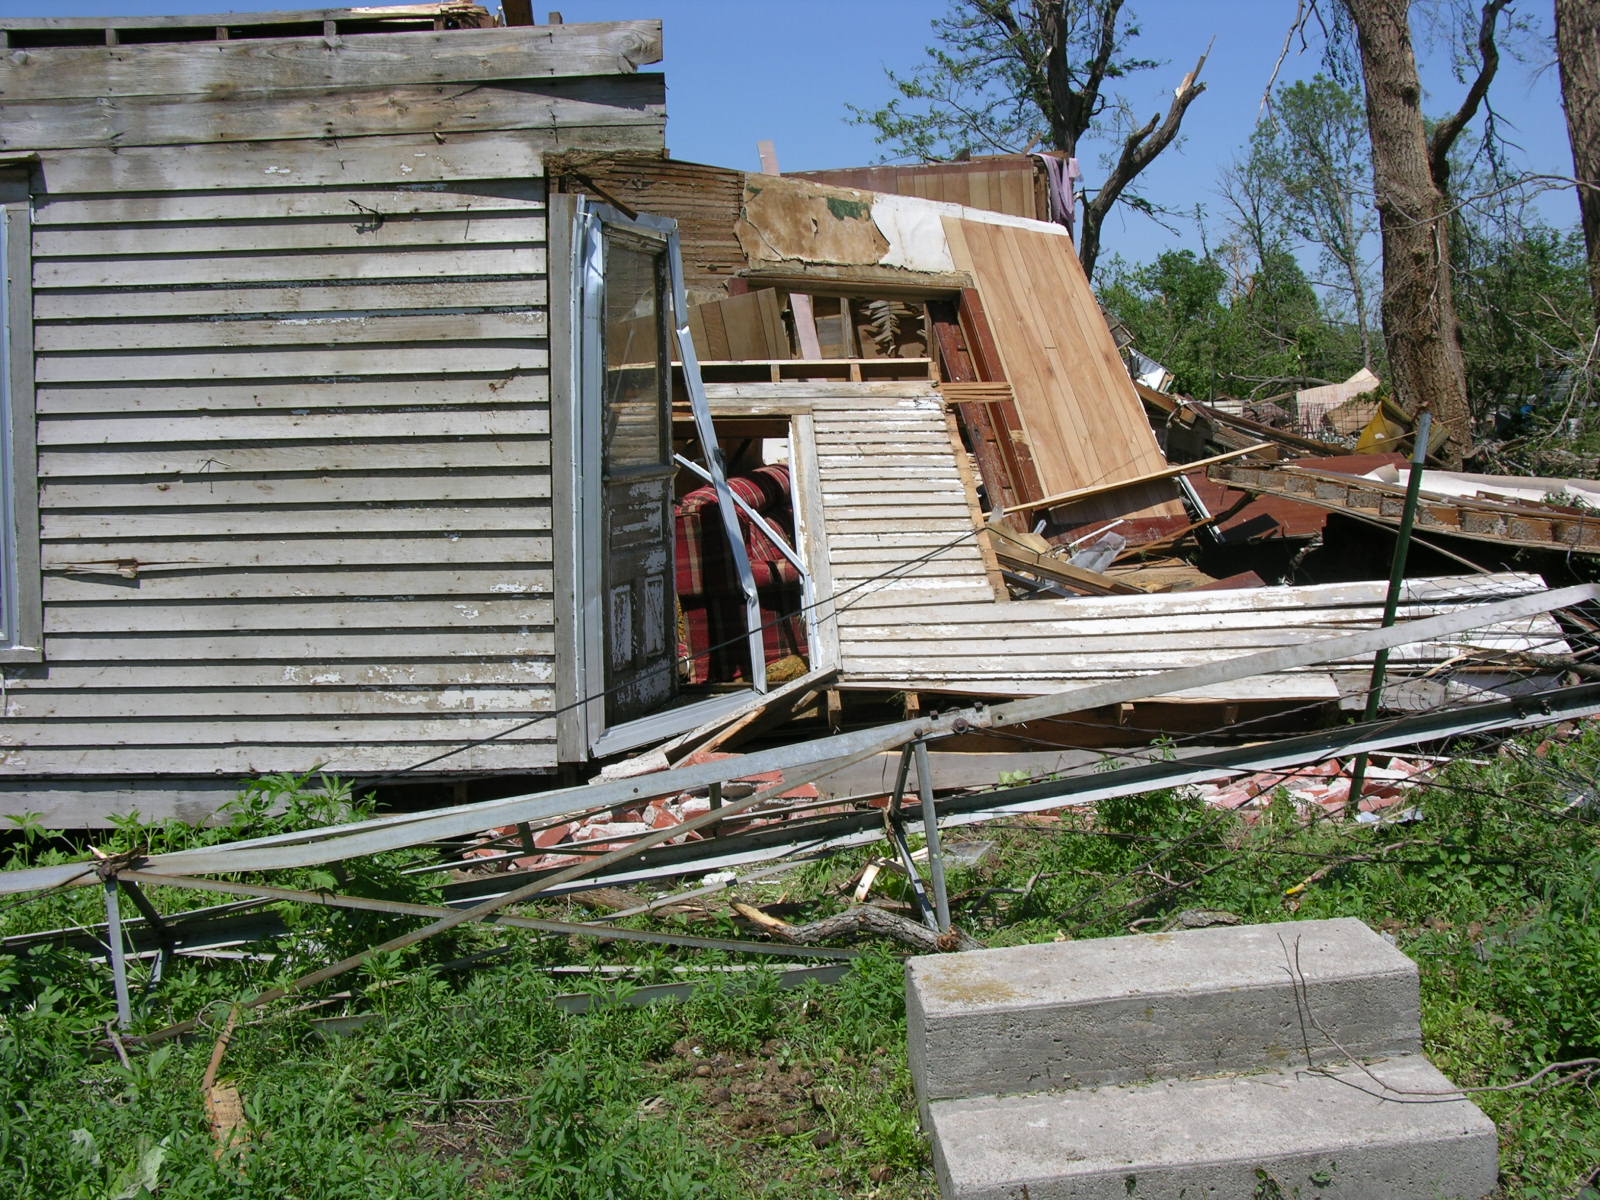
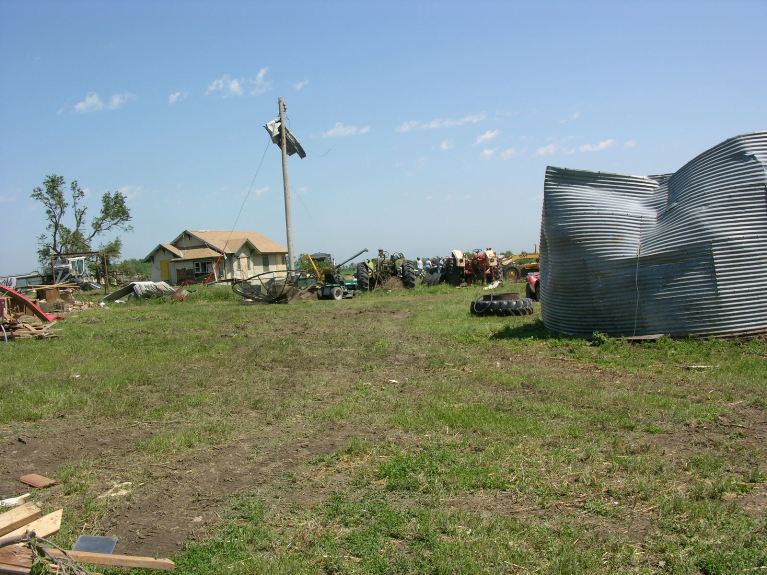
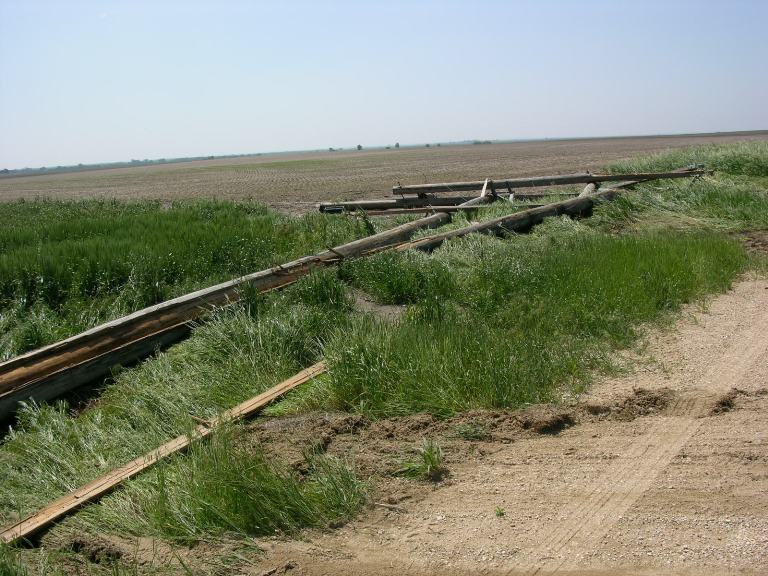
DH's Tornado
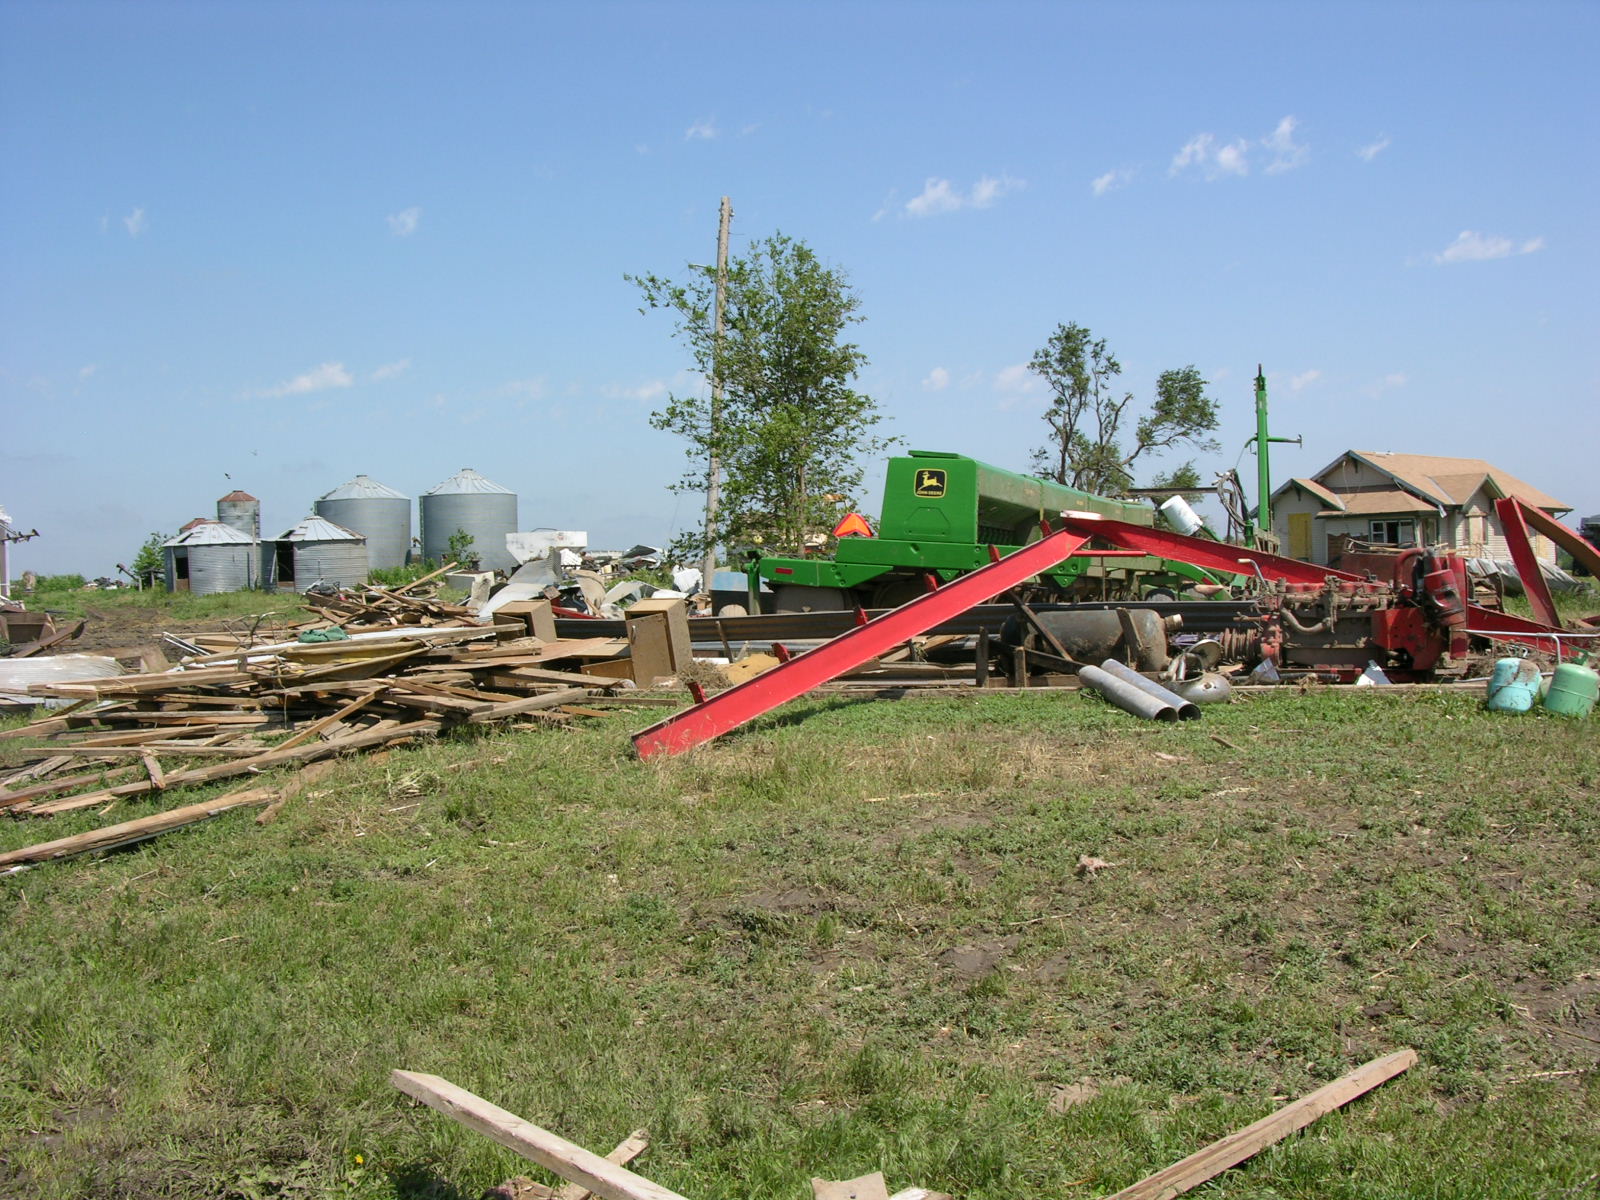
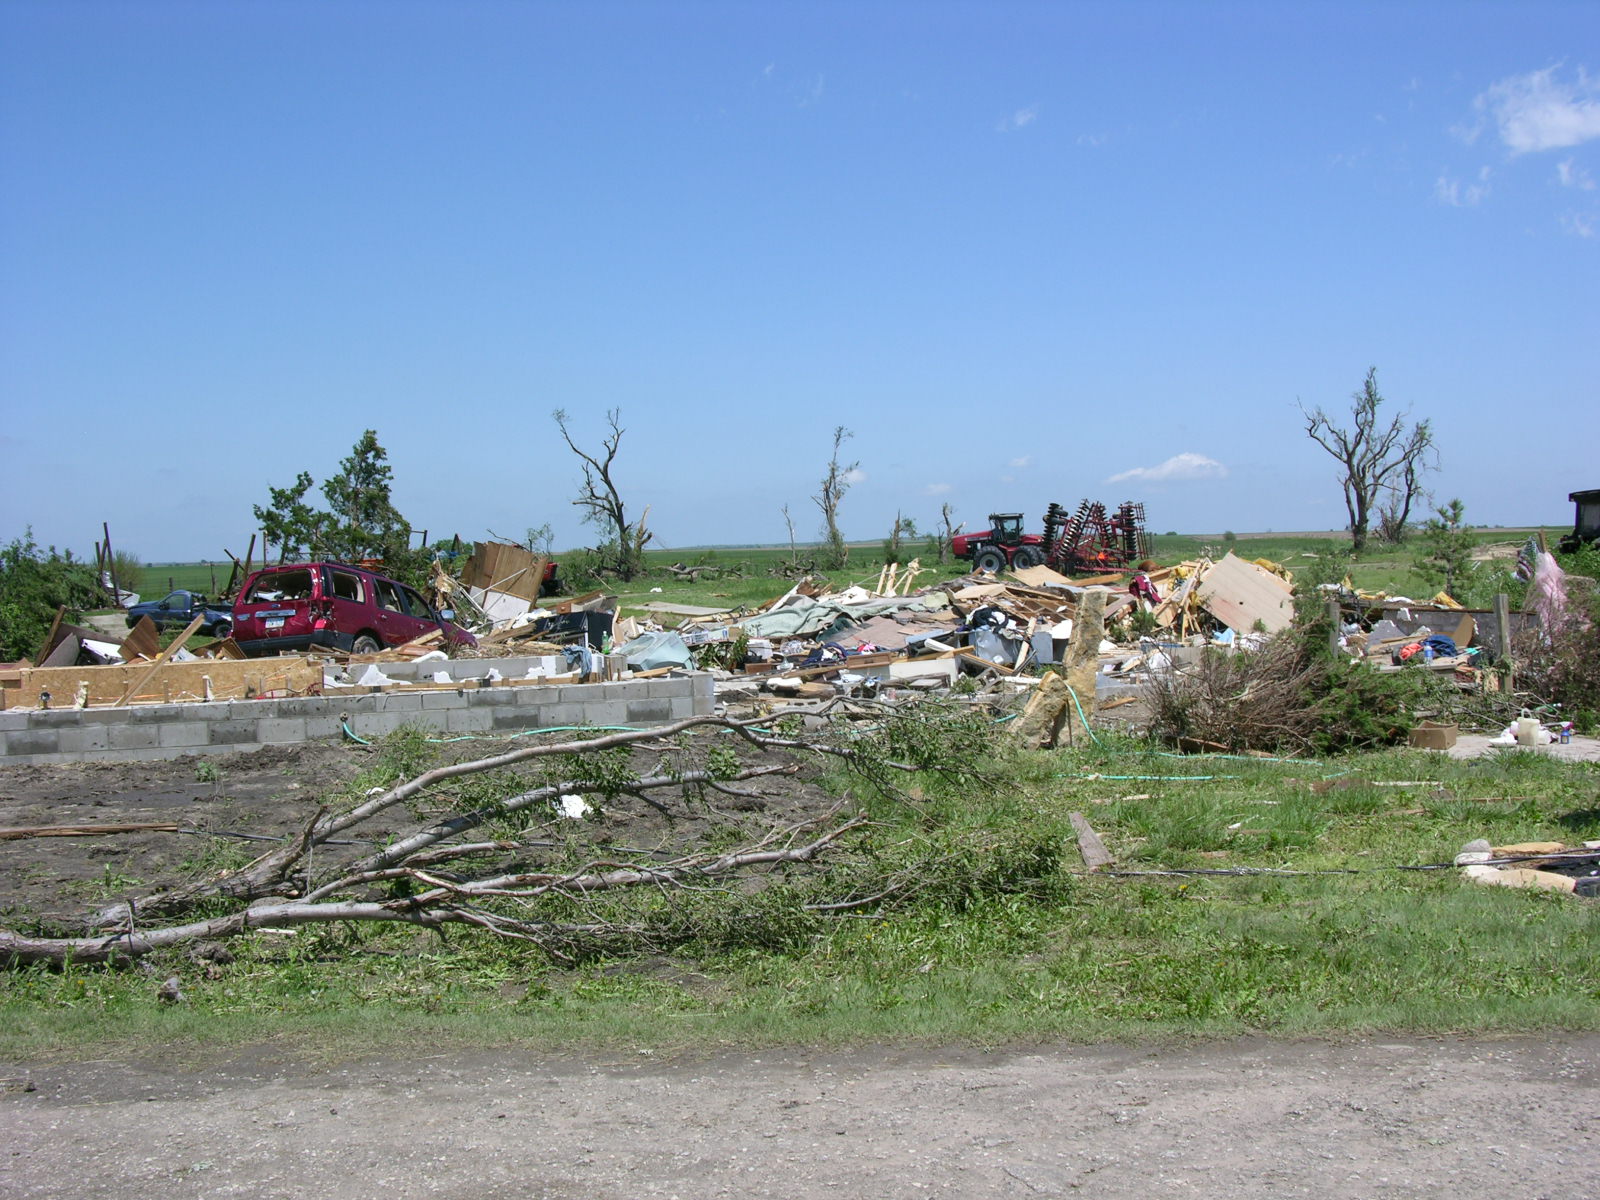
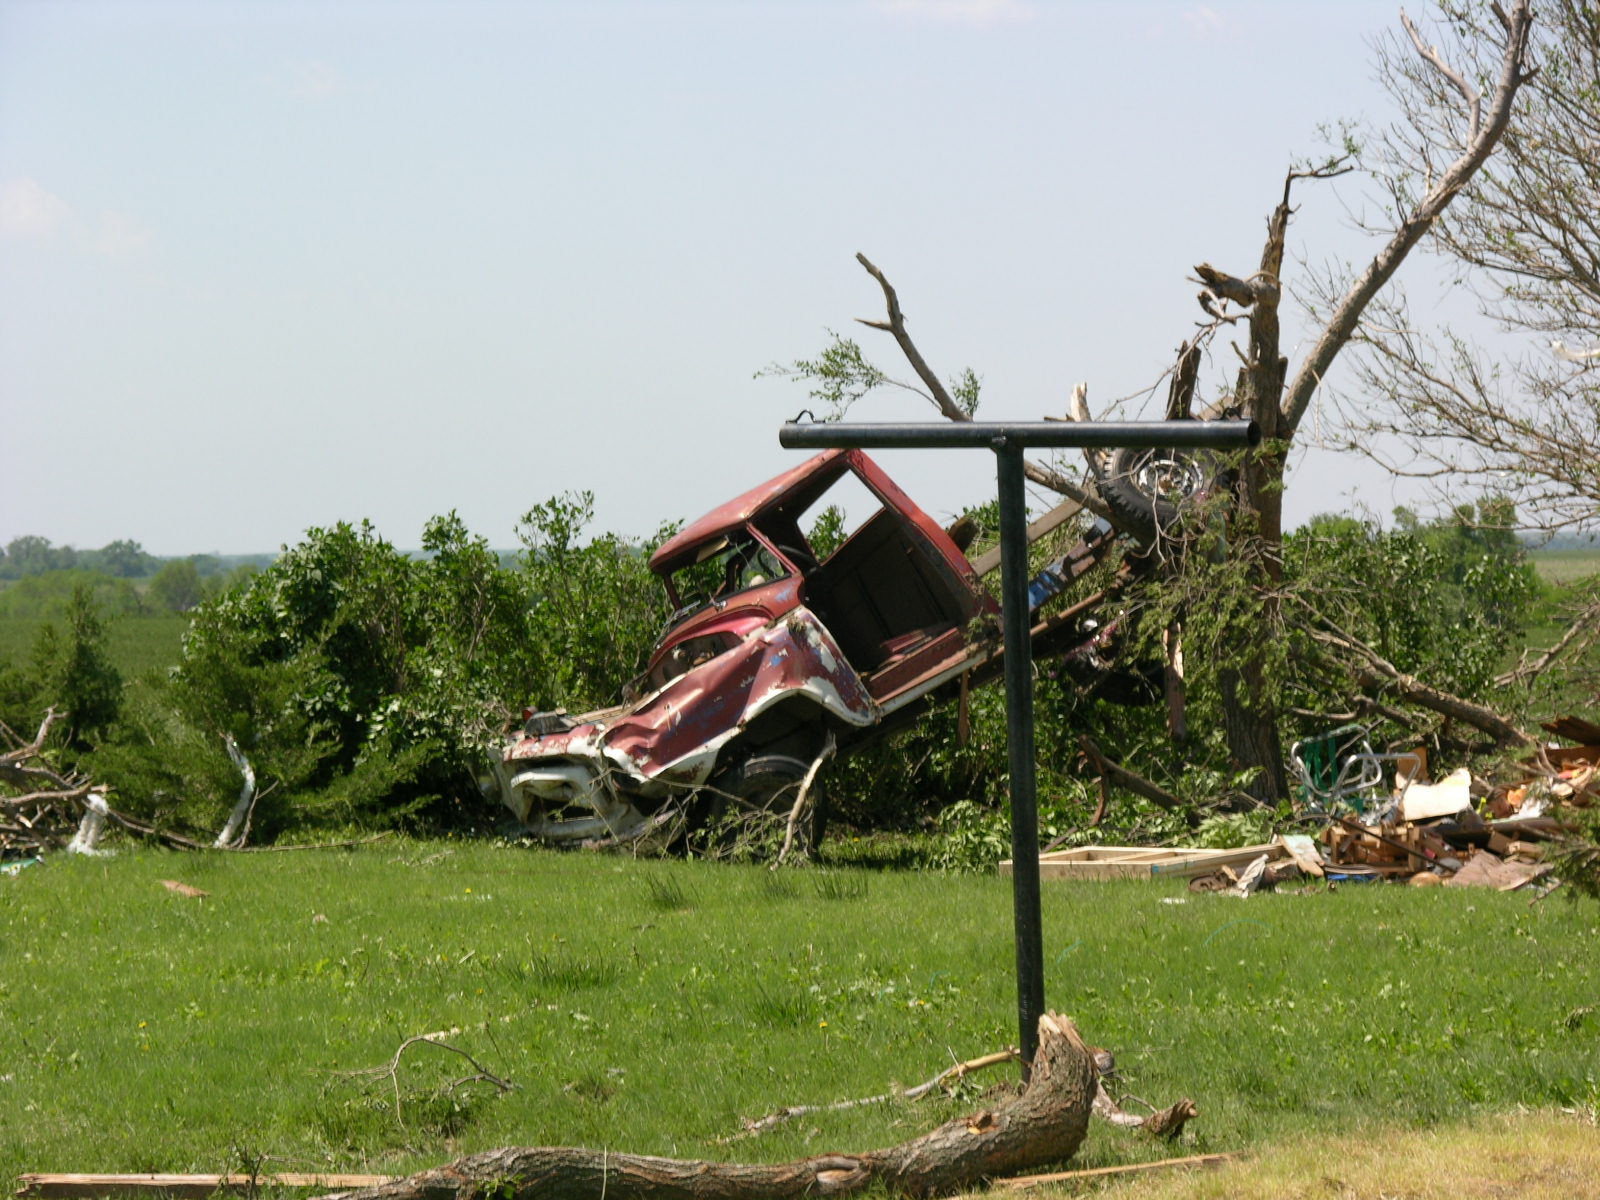
EF3 Tornado Hits Jewell and Mitchell Counties
NWS
damage survey crews have investigated the tornadic storm damage across
Jewell and Mitchell Counties and have rated the tornado an EF3 at its
strongest point. The tornado set down near Glen Elder Dam the night of
May 29, 2008 and tracked to the northeast. The tornado had a path
length of nearly 18 miles and a width up to one half mile.
A description of the EF scale can be found here.
The
city of Jewell and areas around the city were hit especially hard with
major structural damage in the city of Jewell. The water tower was
destroyed/collapsed and multiple businesses including the Jewell CAFE
and Bourbon Trucking were completely destroyed. Several houses in and
south of Jewell sustained major damage.
Additional tornadoes may have occurred in Jewell and Mitchell Counties and this will be investigated over the next few days.
A map of the tornado path and photos of the damage are included below.